
Big Ten QB Stats: What Actually Predicts Winning?
Five years of Big Ten data show which quarterback stats link to wins—and why passing yards don’t.
Every August, the same argument kicks off. Who's got the strongest arm in the conference? Which quarterback is going to pile up the most passing yards? Is that transfer QB finally about to break out? Turn on any preseason show or scroll college football Twitter, and you’ll hear the same stats: yards, touchdowns, completion percentage.
Nobody really stops to ask whether those numbers matter.
But five years of Big Ten football tell a different story. Some teams have put up huge passing numbers and still landed in the middle of the standings. Others have thrown for modest totals and still reached conference title games. Some even made the College Football Playoff.
So, what's really going on? Which quarterback statistics track with winning?
To find out, we dug into five full seasons of Big Ten data, comparing the usual offensive stats against how often teams won. Instead of grading quarterbacks one by one, we looked at each team’s offense. We studied what set frequent winners apart from teams that did not.
How We Ran the Numbers
We pulled every Big Ten team-season from 2021 through 2025. The conference had fourteen teams through 2023, then jumped to eighteen in 2024, which gave us 78 team-seasons total to work with.
One thing worth flagging: we looked at team passing stats, not individual quarterback stats. In practice, the starting QB threw most passes for nearly every team. But backup snaps and injuries were part of it, too. The goal wasn’t to rank quarterbacks. It was to see which offensive traits showed up in winning seasons.
Here's what we tracked for each team:
- Win percentage
- Completion percentage
- Passing yards per game
- Passing attempts per game
- Passing efficiency rating
- Yards per attempt
- Passing touchdowns
- Interceptions
- Touchdown-to-interception ratio
- Rushing yards per carry
- Rushing yards per game
- Points scored per game
- Total offensive yards per play
All of it came from CFBStats and official Big Ten standings.
A quick note on math: Teams don’t all play the same number of games. So we converted raw totals (passing yards, rushing yards, etc.) into per-game averages. We also used winning percentage instead of total wins. That way, every team-season is on equal footing, whether it played 12 or 14 games.
The Tool: Correlation
We used Pearson’s correlation coefficient, often written as r, to measure how strongly two stats move together.
It's a simple scale, from −1.00 to +1.00:
- +1.00 — a perfect positive relationship (as one goes up, so does the other, every time)
- 0.00 — no real relationship at all
- −1.00 — a perfect negative relationship (as one goes up, the other goes down, every time)
Worth repeating, because it's easy to forget; correlation isn't causation. If passing efficiency correlates strongly with winning, that doesn't mean improving your efficiency rating automatically wins you games. It means teams with better passing efficiency also tended to win more, in this dataset. Coaching, defense, special teams, and raw talent all play a role, too.
Roughly speaking, here's how we read the numbers:
|
Correlation (r) |
What it means |
|
0.00–0.19 |
Barely related |
|
0.20–0.39 |
Weak relationship |
|
0.40–0.59 |
Moderate relationship |
|
0.60–0.79 |
Strong relationship |
|
0.80–1.00 |
Very strong relationship |
So What Actually Predicts Winning?
A few things jump out right away.
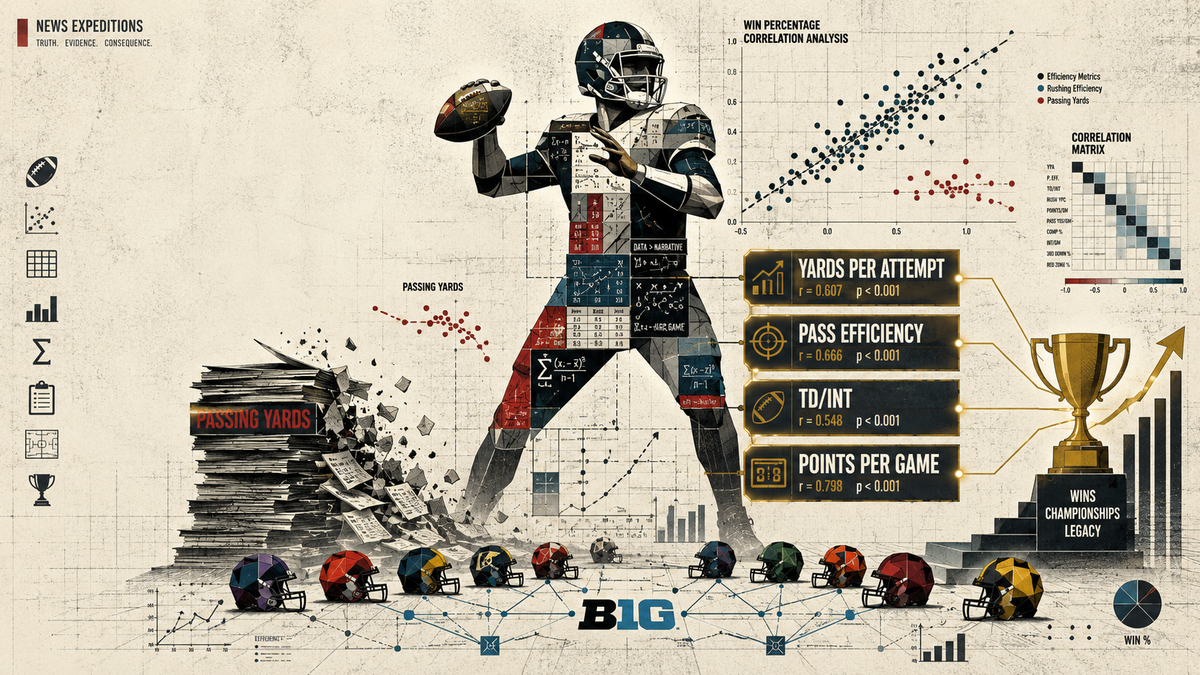
Unsurprisingly, the single strongest predictor of winning was points scored per game (r = 0.798). Teams that score more win more, not exactly a shocking discovery, but it's a good sanity check that the method works.
The more interesting stuff shows up once you look at the quarterback numbers specifically.
Passing efficiency rating had a strong correlation with winning (r = 0.666). Right behind it: total offensive yards per play (r = 0.631) and yards per pass attempt (r = 0.607).
Notice what all three of those have in common; they're about efficiency, not volume.
Meanwhile, plain old passing yards per game barely moved the needle. The correlation was weak.
That gap is really the whole story here.
Why Yardage Lies to You
For as long as people have talked about quarterbacks, passing yardage has been the go-to measuring stick. This data suggests that's a mistake.
Here's the problem: yardage often reflects the situation more than skill. A team down by two scores in the fourth quarter is going to throw the ball constantly, whether or not it's working. Defenses with a big lead will gladly allow short completions all day. They will still refuse to give up big plays. Put those two things together, and you get quarterbacks racking up gaudy stat lines on losing teams.
Efficiency stats don't get fooled the same way.
Yards per attempt rewards quarterbacks who make plays without needing 40 pass attempts. Passing efficiency rating rewards accuracy and ball security. Touchdown-to-interception ratio rewards quarterbacks who turn drives into points instead of turnovers.
Put those together, and they explain winning a lot better than a yardage total ever could.
Winning Football Is About Staying on Schedule
If there's one big takeaway here, it's that football rewards consistency, not box-score padding.
Quarterbacks who protect the ball, hit explosive plays, and get real value from every throw put their offense in good spots. Do that for sixty minutes, and it adds up over an entire season.
Think about it this way: a quarterback who throws for 340 yards but averages 6.4 yards per attempt likely needed 50-plus throws. That offense probably stalled out again and again. A quarterback who averages 9.0 yards per attempt and throws less can still create scoring chances faster. This is true even if his stats look smaller.
Same "productivity," in a sense. Very different offense.
It's Not Just the Quarterback
None of this happens in a vacuum, either. You can't judge a quarterback's numbers without thinking about the offense around him.
Rushing yards per carry had one of the strongest links outside the passing game. It had a moderate to strong correlation with winning (r = 0.558). An efficient run game keeps offenses out of clear passing downs, makes play-action more dangerous, and puts defenses in tough spots.
That also helps explain why total yards per play matched winning so well overall. Explosive offenses need fewer plays to move downfield. This is true whether they pass or run.
In other words, a quarterback’s stat line shows as much about his offense as it does about him.
Bottom Line
Five years of Big Ten data point to the same conclusion: the way most people evaluate quarterbacks is backward.
Passing volume, on its own, tells you surprisingly little about whether a team wins. Efficiency tells you a lot more.
The teams that consistently competed for Big Ten titles got more out of each throw. They also ran the ball well and created explosive plays. They were not always the teams with the biggest passing totals.
So, heading into the 2026 season, maybe the preseason question needs an update. Instead of "who's going to throw for the most yards," try asking "who's running the most efficient offense."
Historically, at least in the Big Ten, those have rarely been the same guy.

Comments ()