Big Ten NIL Budgets in 2026: How Much Programs Are Really Spending
A data-driven breakdown of Big Ten NIL budgets and total player compensation in 2026, including financial tiers and program-by-program analysis.
The Conference Didn’t Break Amateurism. It Just Had the Cash to Expose It
College athletics continues to speak in the language of amateurism because it has not figured out how to replace it. Administrators still invoke education, coaches still lean on development, and everyone involved still gestures toward a model that no longer exists in practice. The Big Ten no longer maintains that illusion with much conviction, largely because the numbers have become too visible to ignore.
The approval of the House v. NCAA settlement formalized a system that had already been operating openly. Schools that opted in now distribute roughly $20.5 million annually in direct revenue sharing, while NIL ecosystems continue to generate anywhere from a few million dollars to well over twenty, depending on the program. When those two streams combine, the top of the conference funds rosters at levels approaching $40 million per year, while the bottom tier struggles to clear the mid-twenties. That gap does not just exist on paper. It shows up every Saturday.
An important consideration is that this article presents budget ranges for the entire ecosystem of each University’s payroll distribution across all athletic lines. This is a hub article for a series of evaluations of each organization’s use of those funds across sports.
The Numbers Define the League More Than the Standings Do
Fans still default to the familiar language of rankings, schedules, and coaching matchups. Those factors still matter, but they operate downstream from something more fundamental. The Big Ten now divides along financial lines first and competitive lines second, which means the structure of the league tells you more about outcomes than any preseason poll ever will.
At a baseline, every major program now operates with two levers: institutional and external money. Institutional money arrives through revenue sharing, which places a relatively even floor across the conference. External money arrives through NIL, which does not behave evenly at all. Some programs have organized aggressive donor ecosystems that function almost like front offices. Others rely on looser networks that generate far less consistent results. The difference between those approaches explains why certain programs reload and others rebuild.
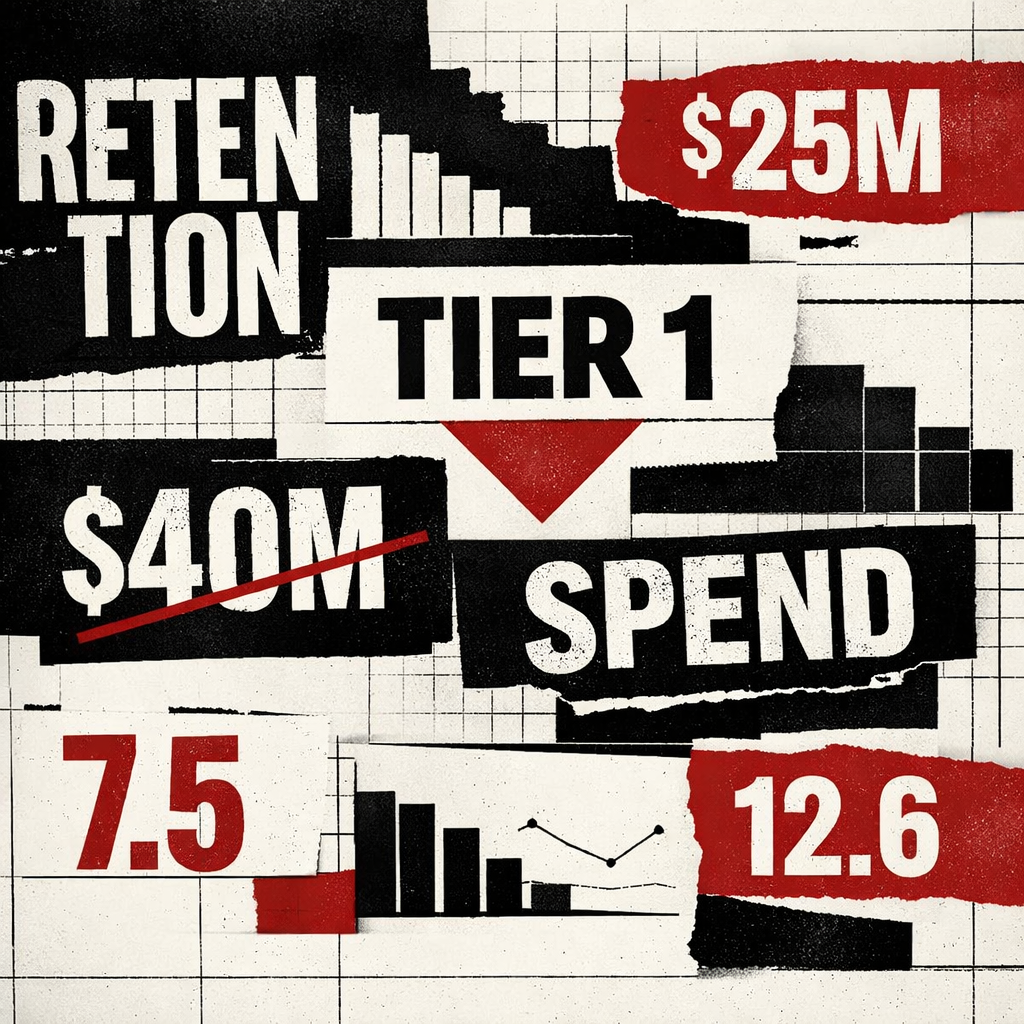
Tier 1: Programs That Buy Stability Instead of Hoping for It
Ohio State, Michigan, and Penn State operate as complete financial systems rather than traditional teams. Their NIL ecosystems range from roughly $12 million to over $20 million annually, which, when combined with revenue sharing, pushes total player compensation into the $32 million to $42 million range. That level of funding allows them to control roster continuity in a way most of the conference cannot match.
What separates this tier is not just recruiting success. It is the ability to retain talent and replace losses without disruption. These programs do not enter the offseason hoping their roster holds together. They plan for movement, fund the response, and move on. Penn State adds another layer through the Penn State Nittany Lions wrestling program, which has developed its own meaningful NIL stream. That kind of multi-sport alignment reinforces the broader athletic ecosystem and makes the overall operation more resilient.
Tier 2: Programs That Decided to Compete on Money Instead of Time
Oregon, Indiana, USC, and Michigan State sit just below the top tier, with NIL ranges generally falling between $11 million and $16 million. When combined with revenue sharing, those programs operate in the low- to mid-$30 million range, placing them firmly in contention even if they lack the full structural depth of Tier 1.
Indiana remains the most revealing case. Once Mark Cuban began supporting football in a serious way, the program’s trajectory shifted quickly. That change did not require a decade of cultural rebuilding or incremental progress. It required alignment, capital, and a willingness to spend. Oregon has operated on a similar principle for years through its relationship with Phil Knight, although with a longer runway and more institutional integration.
Traditionalists still argue that culture ultimately wins out over money. That argument holds some weight in stable systems. It loses credibility when applied to a market where programs can correct mistakes immediately and re-enter the offseason with fresh resources.
Tier 3: Programs With Enough Money to Compete and Enough Inconsistency to Frustrate Everyone
Nebraska, UCLA, and Washington all sit in the middle of the conference in terms of finances, typically operating with total compensation pools ranging from $27 million to $34 million. That range should produce consistent contention. It often does not.
The UCLA Bruins football team remains one of the more puzzling programs in the country. It benefits from a massive media market, strong institutional resources, and access to endorsement opportunities that most schools cannot replicate. Despite those advantages, the program rarely sustains urgency for long enough to translate resources into consistent success. It feels less like a sleeping giant and more like a program that occasionally remembers it could be one.
Nebraska presents a different kind of frustration. Financial commitment exists, the fan base remains fully engaged, and the expectations never fade. The results, however, continue to land in a narrow band that rarely matches the investment. When a program spends close to $30 million annually and still cycles through similar outcomes, it needs to move beyond effort and focus on execution.
Washington fits somewhere in between. The resources are sufficient, the ceiling is visible, and the results fluctuate just enough to prevent any clear conclusion about what the program is.
Tier 4: Development Programs Trying to Outrun the Math
Iowa, Wisconsin, Minnesota, and Illinois continue to rely on development, continuity, and disciplined roster construction. Their NIL ecosystems typically fall between $4 million and $9 million, which pushes total compensation into the mid- to high-$20 million range when revenue sharing is included.
For years, that model produced reliable competitiveness. It still does, to a point. The problem is that the modern system rewards flexibility more than patience. When a higher-tier program loses a player, it immediately replaces him. When a development program loses a player, it absorbs the loss and attempts to grow the next option internally. That approach requires time, and time has become the least available resource in the current environment.
These programs still produce well-coached teams that rarely beat themselves. They also operate with far less margin for error than the programs they are trying to catch.
Tier 5: The Bottom of the Market, Whether by Constraint or Choice
Purdue, Rutgers, Maryland, and Northwestern round out the conference, with NIL ecosystems generally ranging from $2 million to $7 million and total compensation landing between $22 million and $27 million. Some of these limitations reflect genuine constraints. Others reflect priorities.
The Northwestern Wildcats sit in the most uncomfortable position of the group. It benefits from Big Ten revenue, a major media market, and strong institutional branding, yet consistently operates near the bottom of the NIL structure. That outcome does not require much interpretation. It shows that the program has not engaged the system at the same level as its peers.
Rutgers faces a different version of the same problem. The geographic advantages suggest far more upside than the program has captured. Purdue and Maryland occupy a familiar middle ground, where occasional competence never quite turns into sustained structure.
The Scale of the System Is No Longer Debatable
Across the conference, total NIL activity likely ranges from $150 million to $220 million annually. Once revenue sharing is factored in, total athlete compensation exceeds $500 million. At that level, the distinction between college athletics and professional sports becomes largely semantic.
Football continues to dominate spending, capturing roughly 60-75% of the total pool. Men’s basketball follows, with all other sports dividing what remains. A few programs break that pattern, most notably through wrestling, volleyball, and women’s basketball, but the overall distribution remains heavily skewed.
What the Numbers Actually Mean
The standard counterargument still appears whenever these figures surface. Money, people insist, does not guarantee wins. That statement is accurate but incomplete. Money guarantees options. It allows programs to retain talent, recover from mistakes, and maintain depth across a long season. Programs without those advantages depend on near-perfect execution, which rarely holds over time.
The modern Big Ten reflects that reality clearly. The programs with the most flexible financial structures control their rosters and absorb shocks. The programs without that flexibility operate under tighter constraints and narrower margins. Over the course of a season, and especially over multiple seasons, that difference accumulates.
Authority and flexibility by respective athletic directors can be a leveling factor and a significant advantage.
The Real Shift, and Why It Is Permanent
The conference did not intentionally design a professional system. It simply had the resources to arrive there first. Once NIL exposed the market and revenue sharing formalized it, the transition became irreversible.
Some programs recognized the shift and adjusted immediately. Others continue to speak in the language of a previous era while competing in a new one. That gap between rhetoric and reality explains much of what now separates the top of the Big Ten from the rest.
FAQ
Who spends the most in the Big Ten?
Ohio State leads the conference, with NIL spending approaching or exceeding $20 million annually and total compensation nearly $40 million.
Where does UCLA fit financially?
UCLA operates in the middle tier, with strong market access but inconsistent conversion of resources into results.
Why does Nebraska struggle despite significant spending?
Because financial commitment creates opportunity, but it does not replace execution, stability, or effective roster management.


Comments ()