Which Big Ten Schools Have the Biggest Athletic Bureaucracies?
We ranked Big Ten athletic departments by employees per $10 million in revenue to identify the biggest bureaucracies in college sports.
Somewhere in America, an offensive coordinator may be hiring an assistant to help the assistant who supports the recruiting analysts who report to the director of player personnel. College sports have changed.
Fans spend enormous amounts of time debating recruiting rankings, transfer portal additions, coaching salaries, and NIL estimates. Far less attention is paid to the growing army of people working behind the scenes. Athletic departments increasingly resemble medium-sized corporations, employing compliance specialists, NIL coordinators, fundraising staff, attorneys, sports scientists, nutritionists, psychologists, graphic designers, social media strategists, player personnel analysts, and academic advisors.
Revenue sharing and NIL appear to be creating two labor markets simultaneously. One consists of athletes competing for compensation. The other consists of administrators competing to manage an increasingly complex ecosystem. The obvious question is whether athletic departments are becoming more efficient or simply becoming larger.
Measuring Athletic Bureaucracy
To better understand the phenomenon, News Expeditions compiled publicly available employee counts, annual reports, staff directories, university disclosures, and third-party employment estimates, and compared these figures with athletic revenues. The resulting metric is intentionally simple:
Employees per $10 million of athletic revenue.
The metric asks a straightforward question. How many athletic department employees does a university support for every $10 million it generates?
News Expeditions assembled this dataset using publicly available athletic department employee counts, university disclosures, annual reports, staff directories, and third-party employment estimates where official figures were unavailable. Athletic departments do not report personnel in a uniform manner. Some institutions publish full-time employee counts, while others maintain extensive staff directories that include part-time personnel, graduate assistants, or affiliated employees. As a result, these rankings should be viewed as estimates intended to compare administrative intensity across institutions rather than as census-quality headcounts. Athletic revenue figures are generally more reliable and derive from university financial statements, NCAA reporting, and athletic department disclosures. Small differences between institutions may not be statistically meaningful, but larger differences may help identify broad patterns in how Big Ten athletic departments allocate resources.
Most Notably is the Range
The statistic that stands out the most is the range of values. UCLA tallies at North of 25 employees per $10 M of revenue, while USC, a corollary companion, has a value of about 11. Clearly the Big Ten Athletic Departments are approaching administration and management in widely different manners.
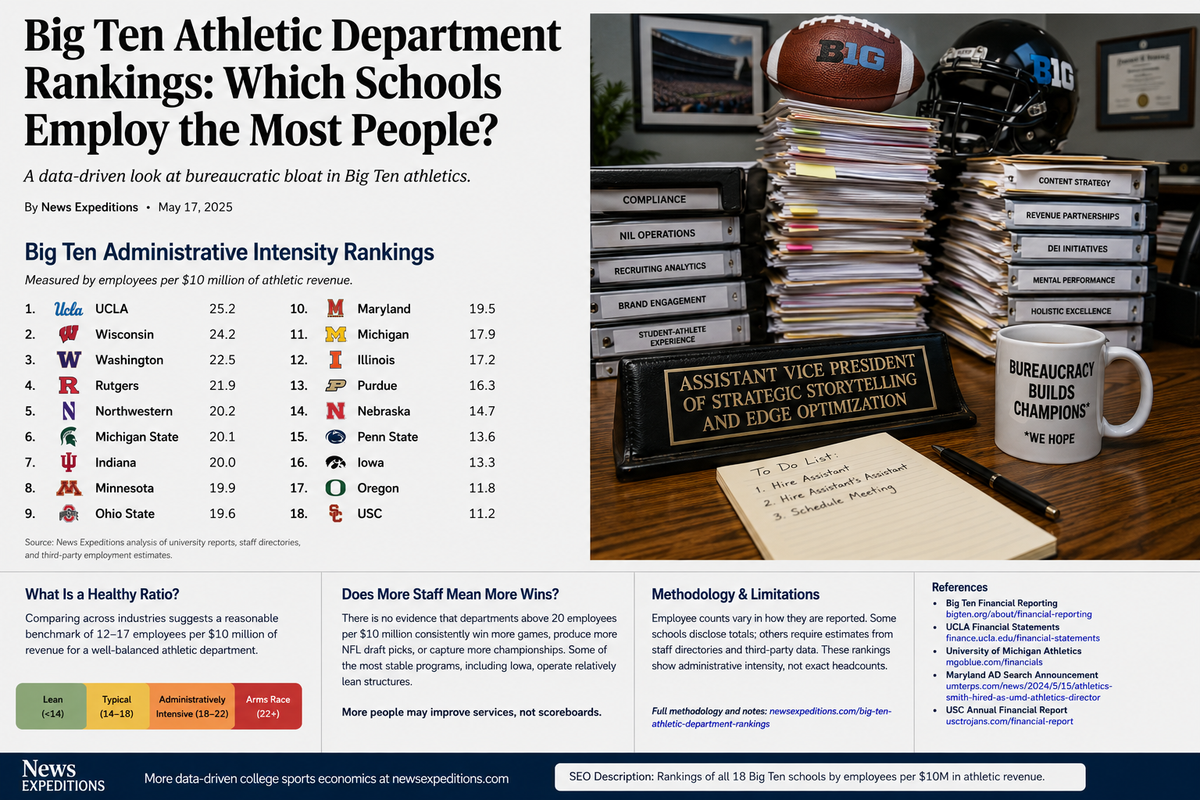
Big Ten Administrative Intensity Rankings
Measured by employees per $10 million in athletic revenue, the Big Ten currently appears to break down as follows:
1. UCLA — 25.2 employees per $10 million
2. Wisconsin — 24.2
3. Washington — 22.5
4. Rutgers — 21.9
5. Northwestern — 20.2
6. Michigan State — 20.1
7. Indiana — 20.0
8. Minnesota — 19.9
9. Ohio State — 19.6
10. Maryland — 19.5
11. Michigan — 17.9
12. Illinois — 17.2
13. Purdue — 16.3
14. Nebraska — 14.7
15. Penn State — 13.6
16. Iowa — 13.3
17. Oregon — 11.8
18. USC — 11.2
The rankings suggest that the conference may contain at least four distinct operating models.
Departments with fewer than approximately 14 employees per $10 million appear relatively lean. Programs with 14 to 18 employees per $10 million likely reflect a typical Power Four administrative structure. Schools operating between 18 and 22 employees per $10 million appear administratively intensive, while departments exceeding 22 employees per $10 million may be participating in what could reasonably be described as an administrative arms race.
What Is a Healthy Ratio?
The private sector offers some useful, if imperfect, benchmarks.
Manufacturing firms generally prefer relatively flat management structures because additional supervisory layers increase overhead without necessarily improving production. Technology companies can generate extraordinary amounts of revenue per employee because software scales efficiently. Mature software companies often produce more than $1 million in annual revenue for every worker they employ.
Professional services firms operate differently. Accounting, consulting, and law firms frequently devote half or more of their revenues to labor because employees themselves are the product being sold.
Athletic departments occupy an unusual middle ground. They function simultaneously as entertainment businesses, media companies, fundraising operations, health care providers, educational support organizations, and compliance enterprises. They are arguably closer to hospitals than factories. Nobody wants to discover that the football program eliminated athletic trainers to pursue operational efficiency.
Based on comparisons with other industries and the observed distribution within the Big Ten, a reasonable preliminary benchmark appears to fall between 12 and 17 employees per $10 million in athletic revenue. Departments within that range seem to have achieved a balance between administrative support and economic scale.
Departments significantly above 20 employees per $10 million may be making intentional investments in athlete services, branding, fundraising, recruiting, and NIL infrastructure. They may also be exhibiting signs of administrative inflation, in which organizations continue to add personnel because revenues permit expansion rather than because additional employees demonstrably improve competitive outcomes.
Does Hiring More People Buy More Wins?
The evidence remains mixed.
Michigan combines a relatively large administrative footprint with elite athletic performance and substantial revenues. Ohio State consistently competes for national championships despite maintaining a middle-tier intensity ratio. Iowa has produced unusually stable football results while appearing to operate one of the conference's leaner administrative structures. Nebraska has expanded its support capabilities over the past decade while continuing to seek sustained football success.
At least for now, there is little evidence that another assistant vice president of strategic storytelling has ever blocked a defensive end.
That does not mean athletic departments are wasting money. Athlete wellness programs, academic support, nutrition services, compliance staff, and fundraising operations all serve legitimate purposes. However, there appears to be a point at which adding personnel yields diminishing competitive returns.
Natural Tendency toward Administrative Bloat
Organizations often develop an uncanny ability to absorb whatever resources become available to them. NIL and revenue sharing may accelerate that tendency. The next decade of college athletics may not simply feature bidding wars for quarterbacks, point guards, and offensive tackles. It may also feature bidding wars for valuation analysts, compliance specialists, player personnel directors, attorneys, content creators, and fundraisers.
The most interesting question may not be which Big Ten athletic department employs the most people. It may be that no one has discovered the point at which additional administrators stop producing additional wins.


Comments ()