Big Ten TV Money: Who Generates It and Who Gets Paid?
Using television audiences, premium windows, and basketball ratings, News Expeditions ranks Big Ten schools by media value and estimates which programs subsidize the conference's equal revenue model.
The Big Ten sells itself as a conference. Television sells it as a product, and so the conference schools are content generators for television and participate in kind in distributions of advertising revenue, in equal parts, thereby earning the term " socialism. "
In essence, the conference has quietly split into two divisions: the revenue generators, who also harvest the wins, and the win donors, essentially functioning as teams that kindly donate wins to the top tier.
The conference talks about history, academics, rivalries, travel, tradition, and institutional fit. A television network cares about a simpler question: will people watch? If the answer is yes, the game has value. If the answer is no, the school may still have value to the league, but it is not creating the same television product.
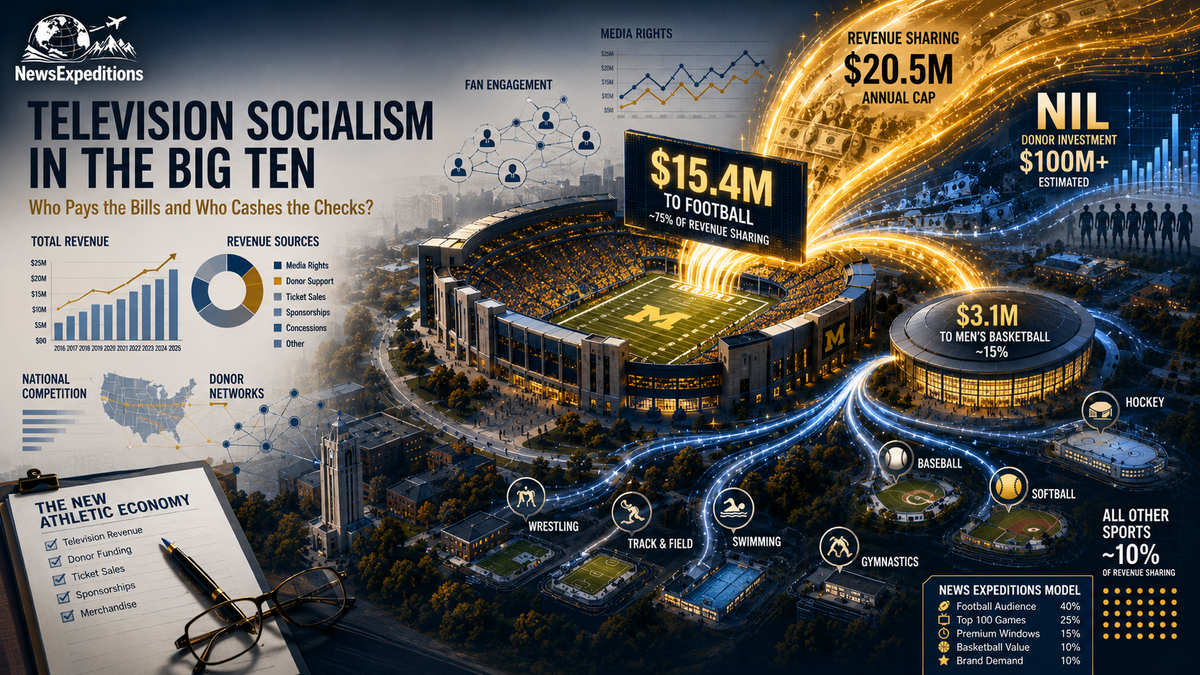
That is where the Big Ten gets interesting. The league’s media deal is worth roughly $7 billion over seven years. The money is distributed across the conference, even though TV audiences are not evenly distributed. Ohio State and Michigan do not draw the same audience as Northwestern and Maryland. Oregon and Penn State do not create the same TV demand as Rutgers or Minnesota. Everyone may be in the same conference, but they are not selling the same amount of television.
To test that idea, News Expeditions built a Big Ten Television Power Score. The model uses three public data points: average football viewership, the number of games with more than 4 million viewers, and men’s basketball TV value. Football carries the most weight because football drives the media-rights business. Basketball matters, but it does not carry the same economic load.
The score is not an official Nielsen ranking. It is a News Expeditions model built from public data. It does not claim to know what FOX, CBS, NBC, Peacock, or the Big Ten privately assign to each school. It asks a narrower question: based on what we can see, which schools appear to create the most television demand?
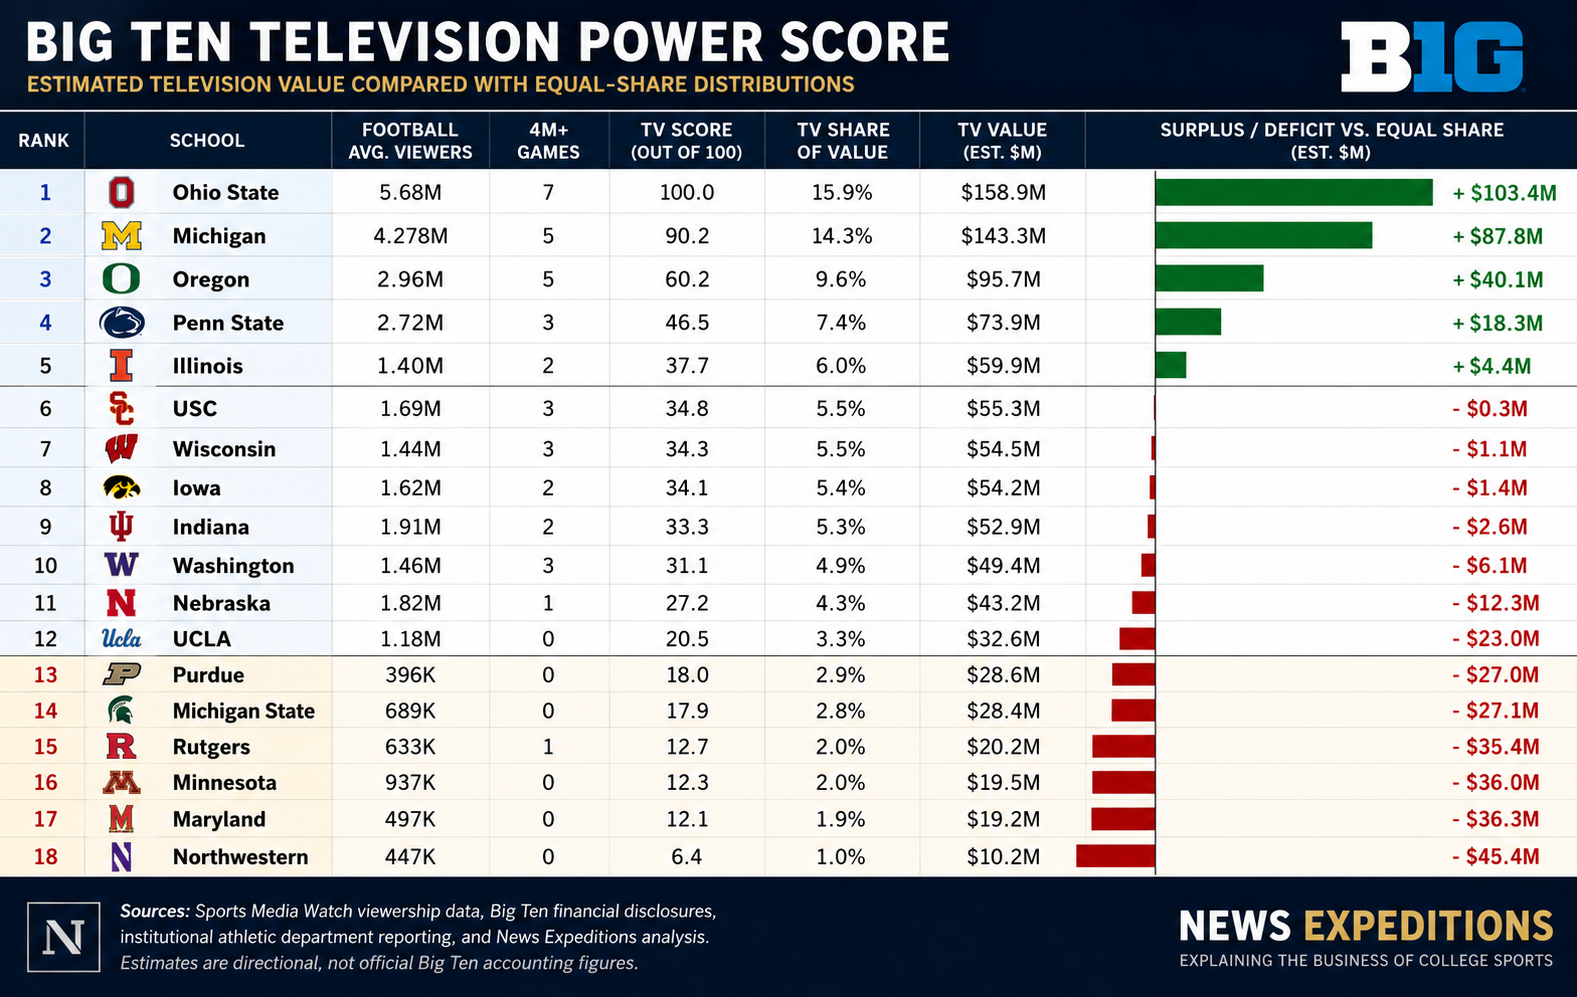
Big Ten Television Power Score
The first thing the table shows is not subtle. Ohio State and Michigan are not merely good television brands. They are the top of the Big Ten economy. Ohio State averaged 5.68 million viewers per football game in available 2025 data, while Michigan averaged 4.278 million. They also produced the most obvious mega-event in the league: Ohio State at Michigan, which drew 18.42 million viewers.
Oregon is the most important new television asset. The Ducks averaged 2.96 million football viewers and appeared in five games with over 4 million viewers. That matters because expansion only works if new schools create more demand than there is inventory. Oregon appears to do that. Penn State remains valuable as well, even in a year when the football audience was not at Ohio State or Michigan levels.
Illinois is the surprise. Its football average was not elite, but it appeared in two games with over 4 million viewers and gained major basketball value from a strong 2025-26 season. Michigan, Purdue, and Illinois all rank among the five most-watched men’s basketball teams nationally, which gives the Big Ten more than football inventory to sell.
The middle of the league is more complicated. USC still has brand power, but the 2025 numbers do not show the Trojans operating like an Ohio State-level television property. Iowa and Wisconsin remain solid, useful TV programs. Indiana had a huge football season, but the model treats that carefully because one great season does not automatically prove permanent brand demand. Nebraska is fascinating because its average audience remains respectable despite years of uneven football. That is a real brand, even if the product has not matched the fan base.
The bottom of the table is where the economics get uncomfortable. Rutgers, Minnesota, Maryland, and Northwestern all have conference value. They provide markets, inventory, academic fit, Olympic sports, and scheduling depth. But their direct television demand is far below the league’s top brands. Under this model, Northwestern accounts for about 1 percent of Big Ten television value while receiving an equal share of the package. That is not an insult; it is the system's structure.
This is the Big Ten’s quiet bargain. The league pools television demand, then shares the money. The top programs create more audience than they retain. The lower-audience programs receive more television money than they likely create on their own.
That is not automatically bad. It may be the reason the Big Ten works. Equal sharing reduces conflict. It keeps the league stable. It allows schools to support their athletic departments more broadly. It also gives top brands a large, organized platform rather than forcing them to operate alone.
But the model does expose the conference’s central tension. The Big Ten is not a pure market. It is a cooperative. A small number of schools appear to account for a large share of demand, while the benefits are spread across the entire group.
Call it risk sharing, conference stability, or television socialism. Whatever name one chooses, the numbers point in the same direction. The Big Ten’s TV money is not created equally, even if it is distributed that way.
Methodology
The News Expeditions Big Ten Television Power Score uses three public indicators.
Football’s average audience carries the greatest weight because it drives the media-rights economy. The model uses Zach Miller’s 2025 average football viewership data, which is based on available Sports Media Watch data. Games without available viewership data are counted as zero in that dataset.
Games with over 4 million viewers are used as a second measure of football because major TV games matter more than ordinary inventory. A school that repeatedly appears in games with over four million viewers has more national TV value than a school whose games are mostly carried by lower-viewership windows.
Basketball receives a smaller but meaningful weight. Michigan, Purdue, and Illinois received major basketball credit because Nielsen data reported them among the five most-watched men’s college basketball teams of the 2025-26 season. Michigan State, Maryland, and UCLA received partial credit for high-viewership basketball games. Schools without major national basketball TV indicators received little or no basketball boost.
The estimated TV value is calculated by multiplying each school’s share of the total Big Ten Television Power Score by an estimated $1 billion annual media-rights package. The surplus or deficit compares that estimate to an equal one-eighteenth share of the same $1 billion pool, or roughly $55.6 million per school. These are model estimates, not official Big Ten or network valuations.
Conclusions
The conference is coming to a reckoning at some point, when the big boys flex their muscles against the bottom feeders and demand more cash, on the premise they create more income. The logic stands to reason; however, there are legal ramifications related to the Big Ten charter and legacy agreements. How that sorts itself out will be an intriguing tale.


Comments ()